

Media Analytics: 7 Numbers That Show If Your Campaign Works
Rauf Kenan Media Analytics 0
Good media analytics turns a pile of campaign data into a clear answer: is this working? Every channel sends its own reports, full of numbers. Most of them describe activity, not results. This guide picks the seven numbers that matter most and shows how to read them together.
Why Media Analytics Is Harder Than It Looks
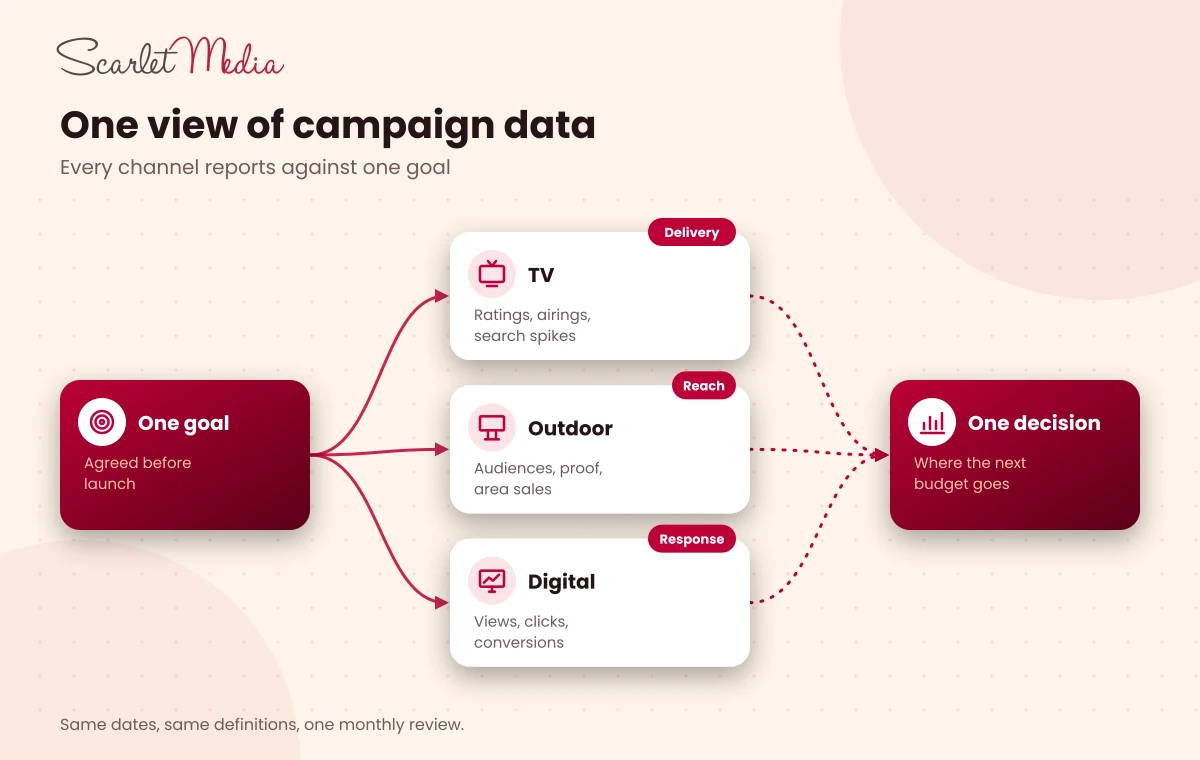
Each channel measures itself in its own way. TV reports ratings. Outdoor reports audiences and proof photos. Digital reports clicks and views. Putting them side by side is not simple.
Marketers feel this gap. In Nielsen’s 2026 marketing survey, 49% of marketers said they use hybrid or full-funnel metrics to measure combined impact. Mismatched data sets also grew as a challenge, up 10 points on the year before. The fix starts with a short list of numbers that everyone agrees on.
Media Performance Analysis: Three Levels
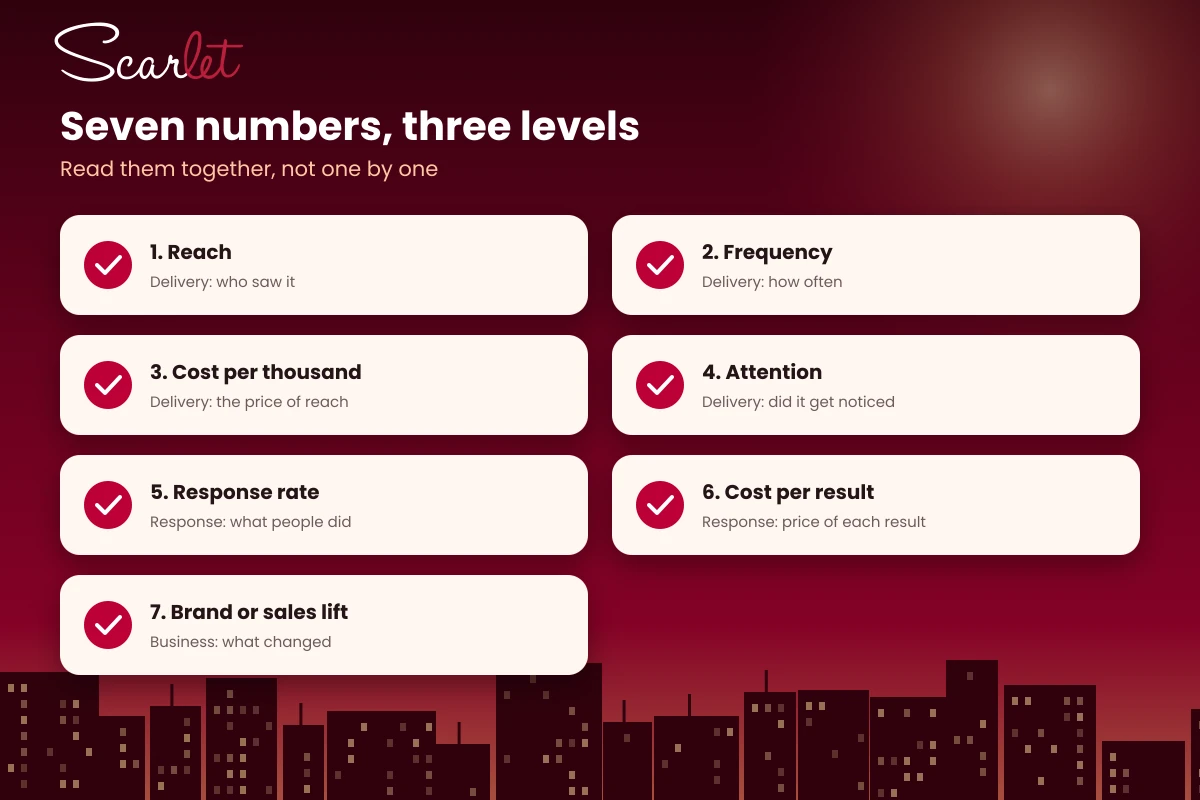
Strong media performance analysis looks at three levels:
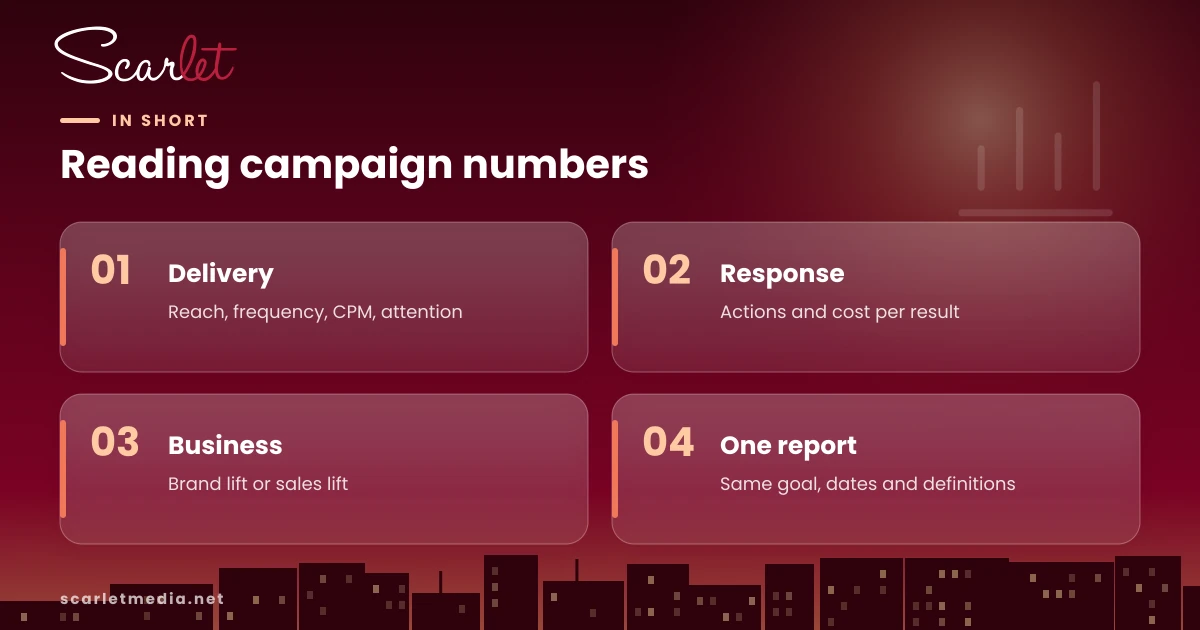
- Delivery: did the campaign reach the people it paid for?
- Response: did those people do something?
- Business result: did sales, leads or brand health move?
The seven numbers below cover all three levels.
1. Reach
Reach is the share of your target audience that saw the campaign at least once. It is the first test of any plan. A clever ad that reaches 10% of the audience cannot move a market.
2. Frequency
Frequency is how many times, on average, those people saw it. Too low and nobody remembers. Too high and you pay to show the same ad to the same people. Watch reach and frequency together, by channel and in total.
3. Cost Per Thousand
Cost per thousand, or CPM, is what you pay to reach 1,000 people. It lets you compare TV, outdoor and digital on one scale. A low CPM is only good news if the audience is the right one.
4. Attention and Completion
Seeing is not the same as noticing. For video, track how many people watch to the end. For digital ads, track viewability. For outdoor, check site visibility and how long people stay in view. These numbers show whether the ad had a fair chance to work.
5. Response Rate
Response covers the actions people take: searches, site visits, calls, app installs or store visits. Track response during and after each flight. A rise in brand searches after a TV burst is one of the clearest signs that offline media is working.
6. Cost Per Result and Campaign Performance Analysis
Cost per result divides spend by the outcome you care about, such as cost per lead or cost per sale. This is where campaign performance analysis gets practical. Two channels with the same CPM can have very different costs per result.
7. Brand Lift or Sales Lift
The final number is lift: how much awareness, preference or sales grew because of the campaign. Lift studies compare people who saw the ads with people who did not. Sales lift compares areas or periods with and without media.
Media Effectiveness: Reading the Numbers Together
Media effectiveness is never one number. A campaign with strong reach but little response has a message problem. A campaign with strong response but low reach has a scale problem. A low cost per result with falling brand lift can mean you are only harvesting demand that already existed. Read the seven numbers as one story.
Advertising Analytics: Building One View
Advertising analytics brings the channels into one report. A simple setup works for most brands:
- One goal that every channel reports against.
- The same date ranges for all channels.
- Shared definitions, so a lead means the same thing everywhere.
- Tracking links and codes for digital and offline offers.
- A monthly review that ends with a budget decision.
Privacy rules and cookie limits make online tracking harder each year. That is one more reason to use lift tests and trend data, not only clicks.
What a Good Monthly Report Shows
A one-page monthly report is enough for most brands. Put the goal and the result at the top. Then show the seven numbers by channel, with last month’s figures beside them. End with three short lines: what worked, what did not and what changes next month.
Common Mistakes to Avoid
- Reporting clicks as success. Clicks are activity, not results.
- Judging each channel alone. TV often drives searches that digital then gets credit for.
- Changing goals during the campaign. It makes the numbers impossible to compare.
- Collecting data nobody uses. If a number never changes a decision, drop it.
How Scarlet Media Uses Media Analytics
Scarlet Media plans and buys TV, outdoor and digital media in Turkey and Dubai. We agree the key numbers with each client before launch, bring channel data into one report and review it together each month. Each review ends with a clear decision on where the next budget should go.
To talk to our team about your next campaign, email us at [email protected].
Leave a Comment